User guide
Studying a spread
Read the payoff, the analytics, and the risk-based size before you decide.
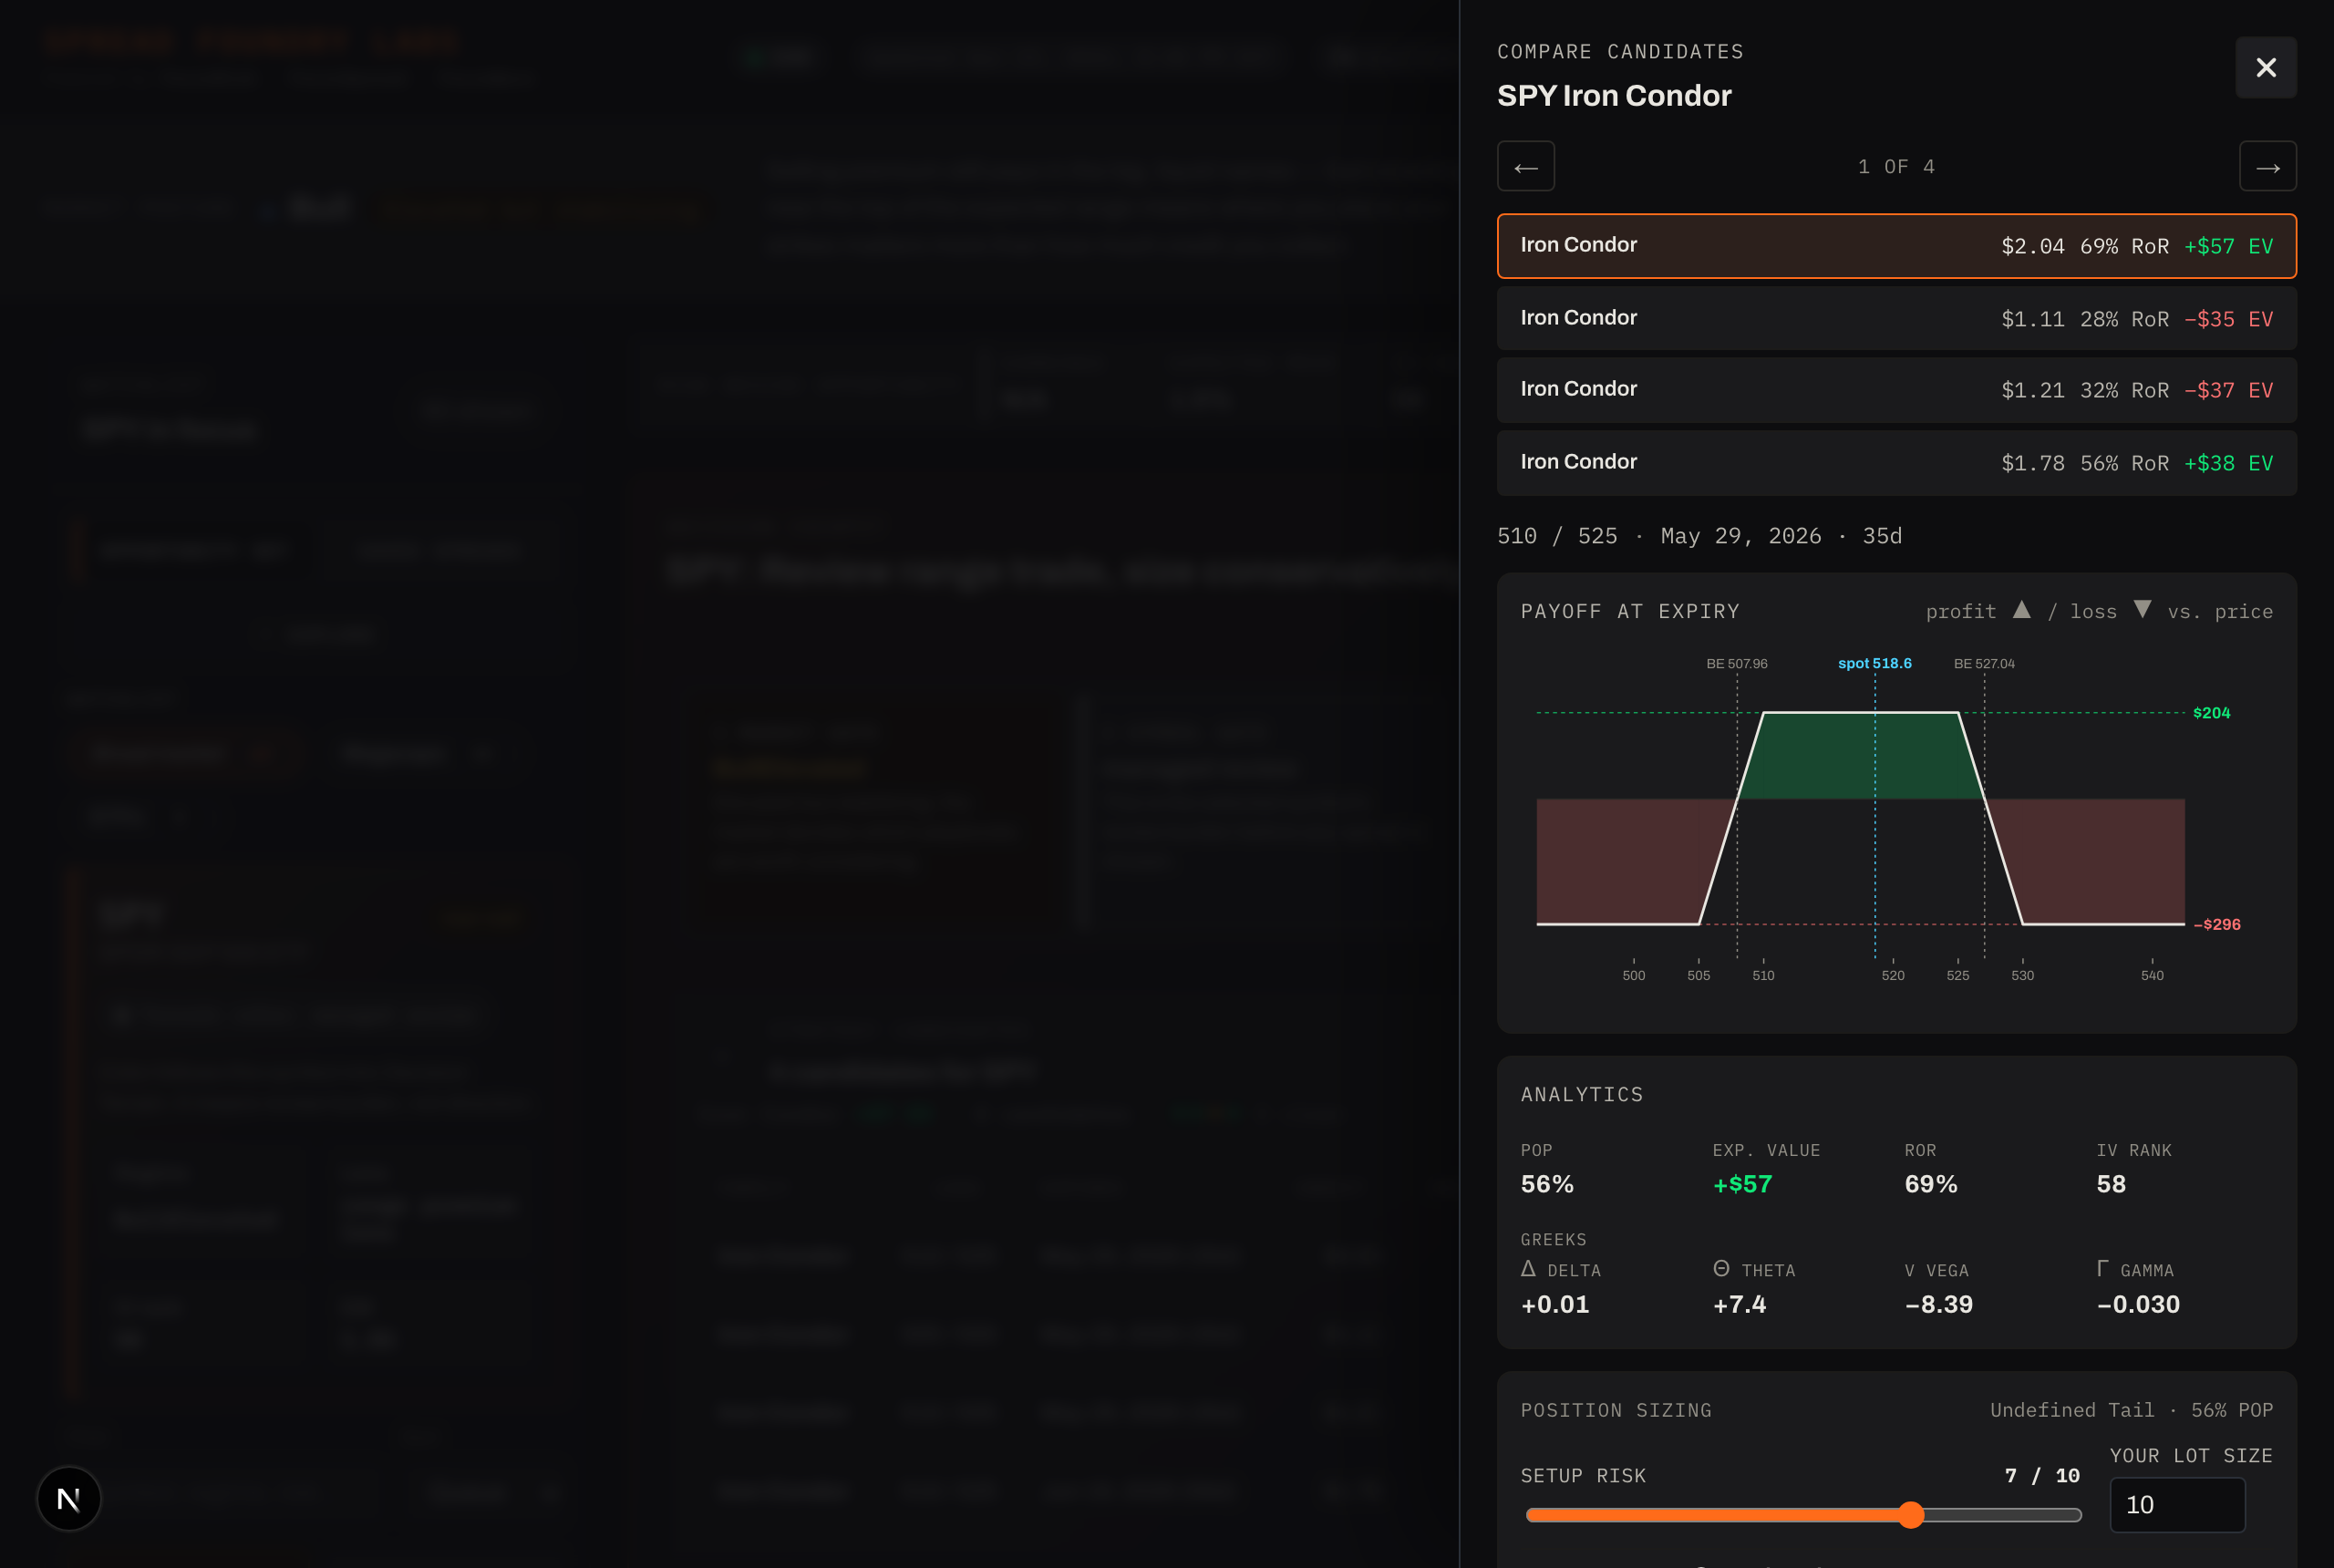
Before you watch or trade a candidate, study it. From the candidates table, click Details to open the compare drawer — a side-by-side view of all of a symbol's candidates that you can flip through, with the selected one shown in full.
The payoff at expiry
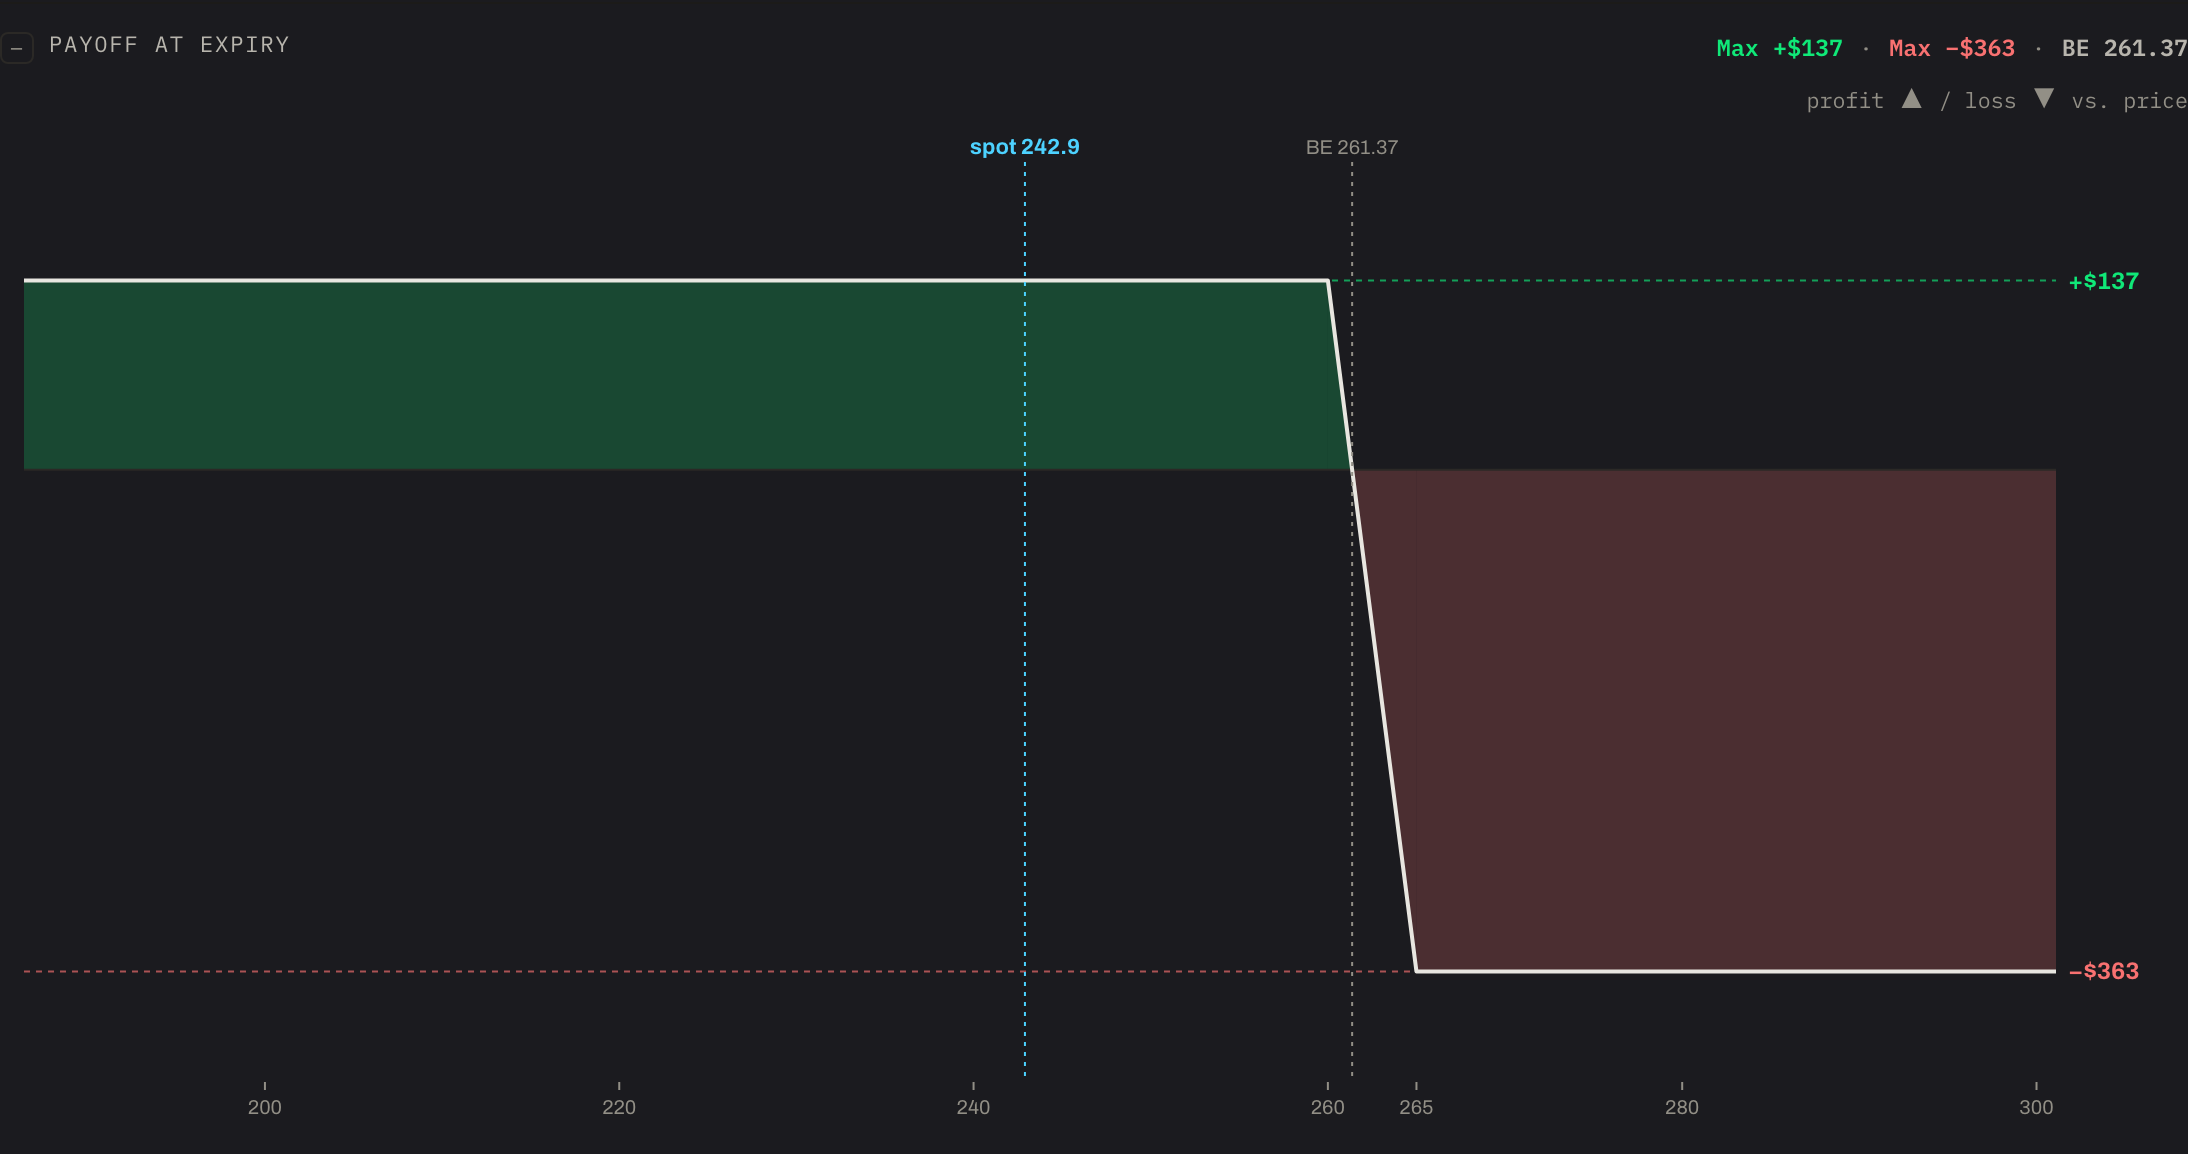
The hero of the study view is the payoff-at-expiry diagram: your profit or loss across the range of prices at expiration.
- The green zone is profit, the red zone is loss.
- Max profit and max loss are marked with their dollar values.
- Break-even(s) are drawn as vertical lines; spot (the current price) is marked too.
- Verticals show an exact curve; iron condors show the full bracket; calendars don't have a single-expiry curve, so they say so rather than draw a misleading one.
The analytics
Alongside the payoff, the numbers that matter for a defined-risk spread:
- POP — probability of profit.
- EV — expected value.
- RoR — return on risk (max profit ÷ max loss).
- IV rank — where implied volatility sits in its range.
- Greeks — delta, theta, vega, gamma.
These are scenario-aware summaries, not isolated headline numbers — the point is to compare candidates on the same basis.
Risk-based sizing
Spread Foundry suggests a size instead of asking for a raw quantity. It scores each candidate's risk from 0–10 (from its risk class, probability of profit, and stress loss), then scales your base lot:
suggested size = base lot × (10 − risk) ÷ 10
So a low-risk candidate sizes near your full lot; a high-risk one sizes down (a 10 means stand aside). Your base lot is a setting you control — see Settings. In the study view this size is a preview; you confirm (and can override) it when you trade.
What's next
When a candidate clears the bar, you have two choices — add it to your watchlist, or trade it now. That's Saving & trading.